If your internet feels slower than it should, you’re not alone—unpatched IoT gear, weak Wi-Fi passwords, and bandwidth-hungry apps can quietly drain performance. A traffic monitor helps you spot red flags like a device uploading gigabytes overnight, repeated connections to sketchy domains, or sudden bursts that coincide with buffering.
More importantly, visibility changes your security posture. When you can monitor home network traffic with a Raspberry Pi, you can confirm whether a “mystery device” is actually a neighbor, a guest’s old phone, or a compromised gadget.
- What You Need: Raspberry Pi Hardware & Software Checklist
- How to Set Up Your Raspberry Pi as a Network Monitor
- Best Tools to Analyze Home Network Traffic (ntopng, Wireshark, Darkstat)
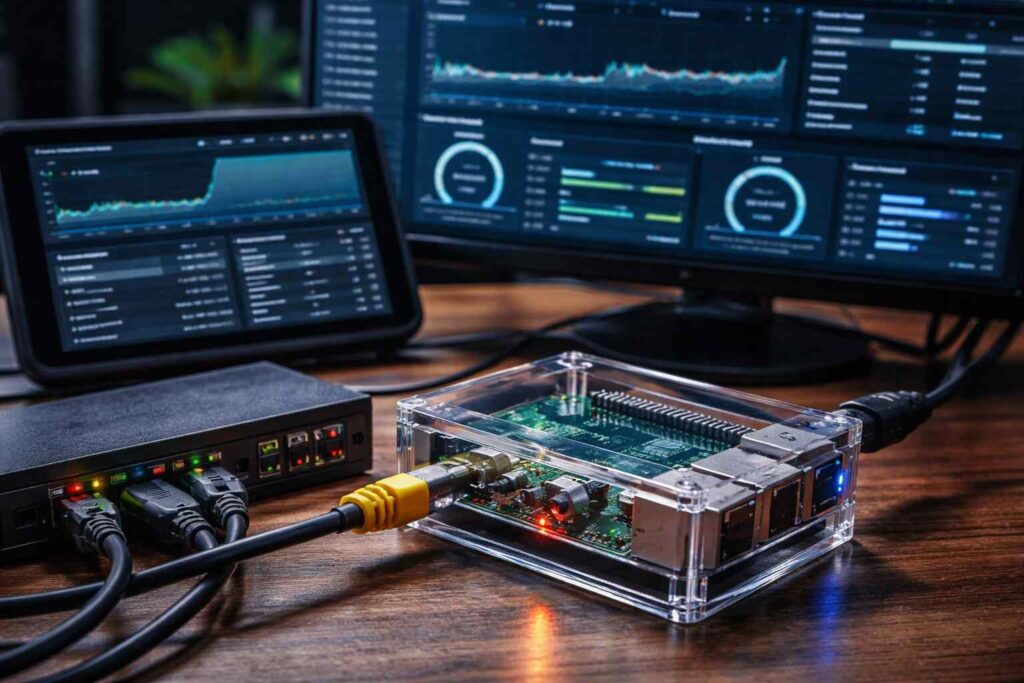
- Build a Real-Time Traffic Dashboard With Grafana
- How to Track Internet Usage Per Device on Your Network
- Detect Suspicious Activity and Secure Your Home Network
- Conclusion
What You Need: Raspberry Pi Hardware & Software Checklist
You don’t need a lab setup—just a few reliable basics.
Hardware
- Raspberry Pi 4 or 5 (2GB+ is comfortable) + official power supply
- microSD card (32GB+) or SSD for better reliability
- Ethernet cable (strongly recommended for accurate monitoring)
- Optional: USB-to-Ethernet adapter (useful for inline monitoring)
Software
- Raspberry Pi OS Lite (headless friendly)
- A monitoring tool (ntopng / Wireshark / Darkstat—covered below)
- Optional dashboard stack (Grafana + a time-series database)
If your router supports port mirroring (sometimes called SPAN), monitoring is easiest. If not, you can still capture traffic by placing the Pi inline (explained next).
How to Set Up Your Raspberry Pi as a Network Monitor
Step 1: Install Raspberry Pi OS Lite and enable SSH
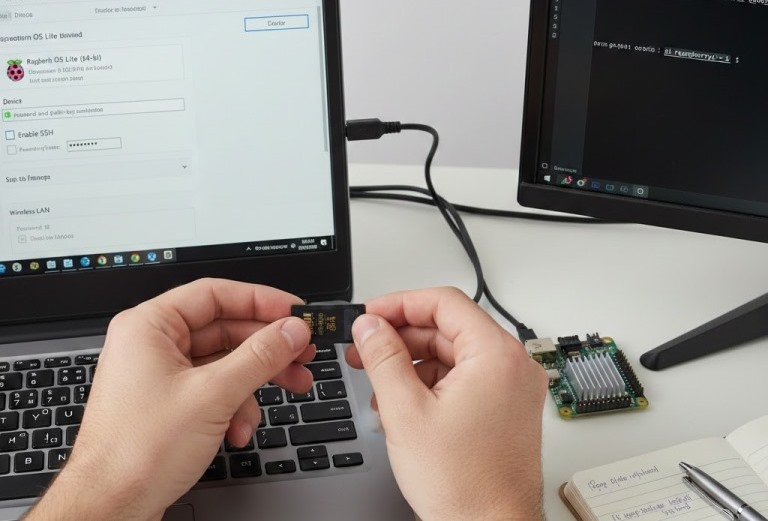
- Flash Raspberry Pi OS Lite to your card/SSD.
- Boot the Pi and update it:
sudo apt update && sudo apt -y upgrade - Enable SSH:
sudo systemctl enable --now ssh
Step 2: Give the Pi a stable IP address
Set a DHCP reservation in your router (preferred), or set a static IP on the Pi. A stable IP makes dashboards and tool access painless.
Step 3: Choose your monitoring method (mirror vs inline)
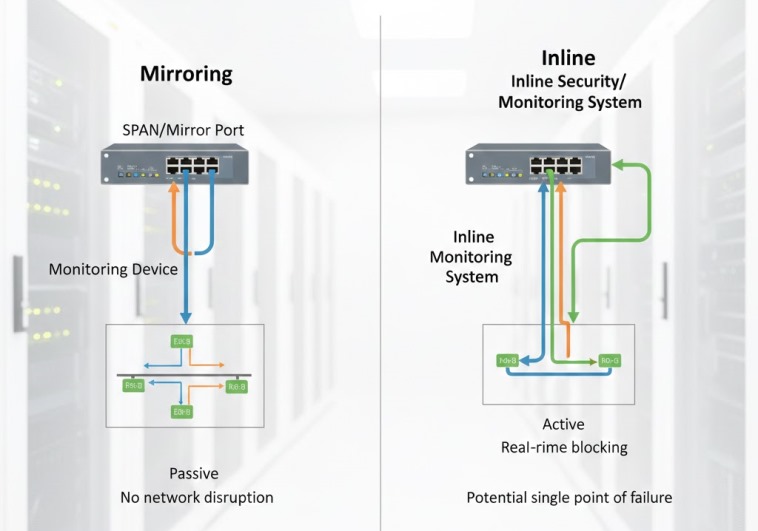
Option A (best): Router/switch port mirroring
If you have a managed switch or router that supports mirroring, mirror your LAN or WAN-facing port to the Pi’s Ethernet port. This gives you broad visibility without changing how your network routes traffic.
Option B (works anywhere): Inline bridge with two NICs
If you don’t have mirroring, use the Pi as a transparent bridge with two Ethernet interfaces (built-in + USB adapter). This turns it into a diy network traffic analyzer raspberry pi setup that can see packets passing through. Keep it simple: place it between your router and switch (or router and a single device you want to profile).
Step 4: Confirm you can see traffic
Install tcpdump and run a quick capture:
sudo apt -y install tcpdump
sudo tcpdump -i eth0 -n -c 50
If you see local IPs and domains, your raspberry pi network traffic monitor pipeline is working.
Also Read: Xfi Complete Guide: Pricing, Unlimited Data, Pods & Perks
Best Tools to Analyze Home Network Traffic (ntopng, Wireshark, Darkstat)
Think of these as different “lenses” on the same problem—overview, deep inspection, and lightweight stats. These are the core home network monitoring tools most DIYers stick with long term.
ntopng (best for dashboards + per-host visibility)
ntopng is excellent for “what’s using my network right now?” views: top talkers, protocols, and trends. A typical raspberry pi ntopng setup is: install, point it at your capture interface, then browse the web UI from your laptop.
Wireshark (best for forensic packet-level answers)
Wireshark is the gold standard for deep packet inspection, but running the GUI on a Pi isn’t ideal. Instead, capture on the Pi and analyze on your PC:
sudo tcpdump -i eth0 -w capture.pcap
Copy the file to your computer and open it in Wireshark. This approach is exactly what people mean by raspberry pi wireshark home network analysis: the Pi captures quietly, your desktop does the heavy lifting.
Darkstat (best for lightweight, always-on summaries)
Darkstat is minimal and efficient. It’s great when you want quick web stats without a full analytics platform. If you’re running a smaller Pi model or want low overhead, it’s a solid “set it and forget it” choice.
Build a Real-Time Traffic Dashboard With Grafana
If you want long-term graphs (daily peaks, weekly trends, “when did this start?”), pair metrics collection with Grafana.
A simple, reliable stack
- Collect metrics (from ntopng exports, or via exporters/agents)
- Store them (InfluxDB or Prometheus—choose one)
- Visualize in Grafana
Once it’s running, you’ll have a raspberry pi bandwidth monitor dashboard that shows throughput over time, busiest devices, and protocol breakdowns. Keep your first dashboard small: WAN in/out, top 5 talkers, and alerts for spikes. You can always expand.
How to Track Internet Usage Per Device on Your Network
To monitor all devices on home network raspberry pi, you need per-host accounting. Here’s how to get it cleanly:
Use DHCP reservations + device labeling
In your router, reserve IPs for your common devices and name them (e.g., “LivingRoom-TV”, “Work-Laptop”). Tools like ntopng become far more readable when IPs stay consistent.
Attribute traffic with “who talked to what”
Focus on:
- Top destinations per device (CDNs vs unknown domains)
- Upload-heavy devices (cameras, cloud backups)
- Protocols (streaming, gaming, torrents, VPN)
If a device changes identity often (random MAC/Wi-Fi privacy), consider disabling private MAC for your home SSID on trusted devices—otherwise per-device history gets messy.
Detect Suspicious Activity and Secure Your Home Network
Once you can see traffic patterns, you can act quickly when something looks off.
Practical red flags to watch
- Repeated DNS requests to random-looking domains
- Unexpected outbound connections from IoT devices
- Large uploads when nobody’s home
- Devices scanning many internal IPs/ports
Quick hardening moves that actually help
- Put IoT devices on a guest network or VLAN (if your router supports it)
- Block outbound traffic for devices that don’t need internet access
- Turn on automatic firmware updates where possible
- Use strong Wi-Fi security (WPA2/WPA3) and rotate passwords after guests
Even basic segmentation + visibility prevents most “silent” compromises from spreading.
Conclusion
You don’t need enterprise gear to monitor home network traffic with a Raspberry Pi—just a clear setup, the right tool for your goal, and a habit of checking trends. Start with port mirroring (or an inline bridge if needed), verify captures with tcpdump, then pick your daily driver: ntopng for visibility, Wireshark for answers, Darkstat for simplicity. When you’re ready for long-term insight, build a raspberry pi grafana network traffic dashboard and let your data tell you what “normal” looks like.